Build a Power BI date table in DAX: CALENDAR and ADDCOLUMNS, with no gaps
Every year-over-year comparison in Power BI rests on a table most reports never show: a date table with one row per day, no gaps, covering the prior year. This guide builds that table in DAX — CALENDAR for the dates, ADDCOLUMNS for the Year, MonthNumber, MonthName, Quarter, and MonthYear columns. The result is 731 rows from 1 January 2024 to 31 December 2025, covering all 22 months of the sample sales file, and it is the table the other guides in this series build in their second step.
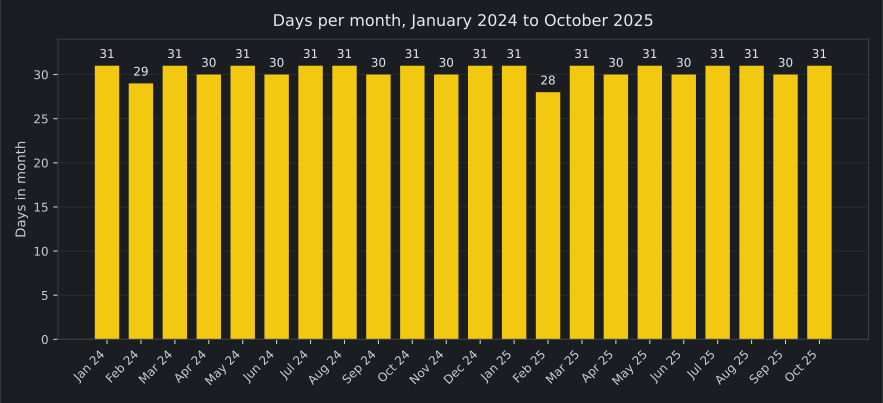
Key result: 731 rows, 1 January 2024 to 31 December 2025, no gaps and no duplicate dates. February 2024 has 29 days; February 2025 has 28. All 22 months of the sample sales file — January 2024 to October 2025 — are present, each with its quarter and its MonthYear label.
Download the data and the calendar table: the sales file (CSV) (66 rows, MD5 51a16fd9e023dd0208564a0c2c1a089e) and the calendar table file (DAX) (the calculated-table definition below, ready to paste). The data is a constructed sample — three product lines, monthly revenue from January 2024 to October 2025 — not a real company's sales.
What you need
- Power BI Desktop on Windows. Desktop is a Windows application; there is no macOS or Linux version, and no headless runner.
- The sample file the sales file (CSV): columns
Month,Category,Units, andRevenue. One row per category per month, 66 rows. - Nothing else. No database, no service, no account.
1. Import the sales file
In Power BI Desktop, go to Home > Get data > Text/CSV, pick the sales file, and choose Load. Check the column types after loading: Month must be a date, Revenue a decimal number, and Units a whole number. If Month loads as text, the relationship in step 6 will not work — change the type in Power Query first.
2. Why the sales date alone is not enough
The sales file's Month column looks like a date column, and in a small way it is: one value per month, the first of the month, from January 2024 to October 2025. But time-intelligence functions do not work on month-level dates. SAMEPERIODLASTYEAR shifts the dates in the current filter context one year back; with only 22 month-start values to shift from, there is no daily context for the shift to land on, and the function returns blank. The fix is a separate table with one row per day, continuous, with no gaps — that is what a date table is. Microsoft's documentation says to mark one of the tables containing a date column as the date table before using time-intelligence functions (Microsoft Learn — Set and use date tables in Power BI Desktop). The same page lists the validations Power BI runs when you mark a table: unique values, no nulls, contiguous dates from beginning to end, and a single timestamp when the column is Date/Time. A month-level column fails the contiguity check by construction: 1 February 2024 is followed by 1 March 2024, with 28 days missing in between.
3. Build the calendar table
Create it as a calculated table (Modeling > New table). CALENDAR returns a table with a single column named Date containing a contiguous set of dates from the start date to the end date, inclusive of both (Microsoft Learn, CALENDAR function (DAX)). ADDCOLUMNS adds calculated columns to that table, one expression per column, evaluated for each row (Microsoft Learn, ADDCOLUMNS function (DAX)). The calendar table file (DAX) holds the same definition, ready to paste.
Calendar =
ADDCOLUMNS (
    CALENDAR ( DATE ( 2024, 1, 1 ), DATE ( 2025, 12, 31 ) ),
    "Year", YEAR ( [Date] ),
    "MonthNumber", MONTH ( [Date] ),
    "MonthName", FORMAT ( [Date], "mmmm" ),
    "Quarter", "Q" & FORMAT ( [Date], "Q" ),
    "MonthYear", FORMAT ( [Date], "mmm yyyy" )
)
What each column does: YEAR returns the year of a date as a four-digit integer (Microsoft Learn, YEAR function (DAX)). MONTH returns the month as a number from 1 (January) to 12 (December) (Microsoft Learn, MONTH function (DAX)). FORMAT converts a value to text according to the format string (Microsoft Learn, FORMAT function (DAX)) — "mmmm" gives the full month name, "mmm yyyy" gives Jan 2024, and "Q" gives the quarter number, so "Q" & FORMAT(...) gives Q1 to Q4. MonthNumber exists so MonthName can be sorted in calendar order — text sorts alphabetically, so without it April comes before January in every visual. Keep MonthName as text and MonthNumber as a number; the sort step is in step 5.
Why the range is 2024–2025: the range must cover the prior year for every month you compare. The sales file runs January 2024 to October 2025, and the comparisons in this series are 2025 against 2024 — so the table has to start on 1 January 2024. A table starting 1 January 2025 would leave every prior-year lookup blank. It runs to 31 December 2025 so the latest year is complete: a table that stops at the last sales month breaks the moment a November row arrives. The count follows from the range: 2024 is a leap year with 366 days, 2025 has 365, so the table has 731 rows.
4. Mark it as the date table
Select the Calendar table in the Fields pane, right-click, and choose Mark as date table > Mark as date table, with Date as the date column. The same Learn page describes both the right-click path and the Table tools ribbon path (Microsoft Learn — Set and use date tables in Power BI Desktop). Power BI then validates the Date column — unique values, no nulls, contiguous dates — and removes the built-in hidden date tables it generated for the model. If marking fails, the range has a gap: CALENDAR cannot produce one, so check that no filter or calculated column has removed dates.
5. Build the Year > Quarter > Month hierarchy
In the Fields pane, right-click Year and choose Add to hierarchy > New hierarchy, then drag Quarter and MonthName into the hierarchy below Year, in that order. The hierarchy is Year > Quarter > MonthName: a visual can drill from a year to its four quarters to its twelve months. Then fix the sort: select MonthName, and on the Column tools ribbon choose Sort by column > MonthNumber, so months appear January to December instead of alphabetically. MonthYear is a display label for tables and cards; use the hierarchy, not the label, for drilling.
6. Relate Calendar[Date] to Sales[Month]
In Model view, drag Calendar[Date] onto Sales[Month]. The relationship is one-to-many, single direction, from Calendar to Sales. One calendar date matches many sales rows; no sales row matches more than one calendar date. If the relationship shows as many-to-many or inactive, the Month column is the wrong type — go back to step 1 and fix it.
7. Check the numbers
Add a table visual with MonthYear on the rows and a count of Calendar[Date] as the value. Every row must match this table, which was computed independently in Python from the same date range:
| Month | Days in month | Quarter | Year | Month name | MonthYear |
|---|---|---|---|---|---|
| January 2024 | 31 | Q1 | 2024 | January | Jan 2024 |
| February 2024 | 29 | Q1 | 2024 | February | Feb 2024 |
| March 2024 | 31 | Q1 | 2024 | March | Mar 2024 |
| April 2024 | 30 | Q2 | 2024 | April | Apr 2024 |
| May 2024 | 31 | Q2 | 2024 | May | May 2024 |
| June 2024 | 30 | Q2 | 2024 | June | Jun 2024 |
| July 2024 | 31 | Q3 | 2024 | July | Jul 2024 |
| August 2024 | 31 | Q3 | 2024 | August | Aug 2024 |
| September 2024 | 30 | Q3 | 2024 | September | Sep 2024 |
| October 2024 | 31 | Q4 | 2024 | October | Oct 2024 |
| November 2024 | 30 | Q4 | 2024 | November | Nov 2024 |
| December 2024 | 31 | Q4 | 2024 | December | Dec 2024 |
| January 2025 | 31 | Q1 | 2025 | January | Jan 2025 |
| February 2025 | 28 | Q1 | 2025 | February | Feb 2025 |
| March 2025 | 31 | Q1 | 2025 | March | Mar 2025 |
| April 2025 | 30 | Q2 | 2025 | April | Apr 2025 |
| May 2025 | 31 | Q2 | 2025 | May | May 2025 |
| June 2025 | 30 | Q2 | 2025 | June | Jun 2025 |
| July 2025 | 31 | Q3 | 2025 | July | Jul 2025 |
| August 2025 | 31 | Q3 | 2025 | August | Aug 2025 |
| September 2025 | 30 | Q3 | 2025 | September | Sep 2025 |
| October 2025 | 31 | Q4 | 2025 | October | Oct 2025 |
| Jan 2024–Oct 2025 | 670 | — | — | — | — |
The 22 months hold 670 days; the full table holds 731 rows through 31 December 2025. If a month shows the wrong day count, the range is wrong: February 2024 must read 29 — if it reads 28, the table starts in 2025, not 2024. If a month is missing entirely, the table was filtered after creation. If MonthName sorts April first, the sort-by-column step in step 5 was skipped.
Traps
TRAP — A CALENDAR THAT STARTS THIS YEAR. Starting the table at 1 January 2025 looks tidy — it matches the year you are reporting on — and it silently blanks every prior-year comparison, because there are no 2024 dates to shift back to. Start a full year before the first month you compare.
TRAP — MONTH NAMES SORT ALPHABETICALLY. MonthName is text. In a visual it sorts April, August, December, February — unless you set Sort by column to MonthNumber. Set it once, on the table, and every visual inherits it.
TRAP — FORMAT RETURNS TEXT. FORMAT returns a text string, not a number or a date. Quarter and MonthYear are labels: do not put them in a calculation or on a numeric axis. If a visual needs a number, use MonthNumber or Year.
TRAP — AUTO DATE/TIME HIDES THE PROBLEM. Power BI Desktop builds hidden date tables behind every date column by default. With them on, a time-intelligence measure can appear to work while reading the hidden table instead of yours, and then behave differently once the model grows. Turn auto date/time off for the file (File > Options and settings > Options > Data Load) and rely on the marked calendar table.
End state
A calendar table with 731 rows, marked as the date table, a Year > Quarter > Month hierarchy, and a one-to-many relationship to sales. The check table matches on all 22 months, February 2024 reads 29 days, and the year-over-year and running-total measures in this series now have a date table to read from.
Sources
- Microsoft Learn, CALENDAR function (DAX) — returns a table with a single column named "Date" containing a contiguous set of dates, inclusive of both ends
- Microsoft Learn, ADDCOLUMNS function (DAX) — adds calculated columns to the given table or table expression
- Microsoft Learn, YEAR function (DAX) — returns the year of a date as a four-digit integer
- Microsoft Learn, MONTH function (DAX) — returns the month as a number from 1 (January) to 12 (December)
- Microsoft Learn, FORMAT function (DAX) — converts a value to text according to the specified format
- Microsoft Learn — Set and use date tables in Power BI Desktop — when a date table must be marked, how to mark it, and the validations Power BI runs
Checked 11 November 2026. The calendar in the check table was generated in Python 3.12.3 with pandas 2.1.4 for the same range, 1 January 2024 to 31 December 2025: 731 rows, first date 1 January 2024, last date 31 December 2025, no gaps, no duplicate dates. February 2024 has 29 days; February 2025 has 28. The 22 months from January 2024 to October 2025 hold 670 days. Run the check table against your own model; if a row disagrees, the model differs from the one described above.