Power BI first and last sale date in DAX: FIRSTDATE and LASTDATE
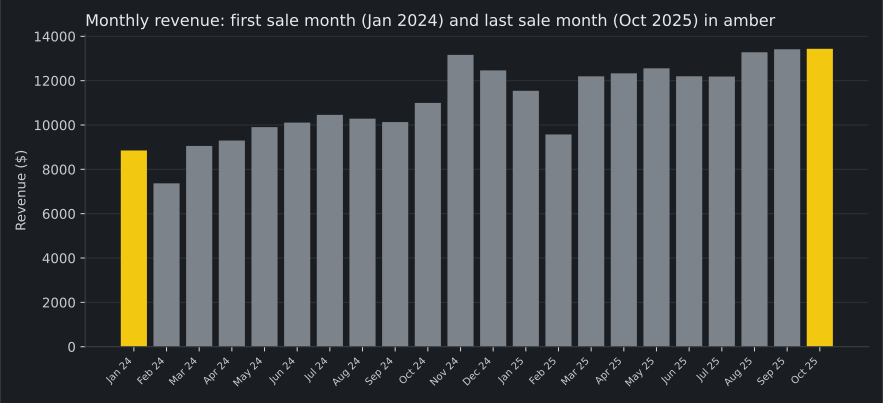
“When did we start selling, and when was the last sale?” sounds like one question about one date column. It is two questions about two different columns: the sales table holds the answers about sales, and the calendar table holds answers about the calendar, and at the end of the file those answers differ by two months. This guide builds five measures that keep the two apart: the first and last sale dates, the count of months with sales, the span between the sale dates, and the last calendar date for contrast. The headline result: a first sale date of 1 January 2024 and a last sale date of 1 October 2025, across 22 months with sales.
Key result: First sale date: 1 January 2024. Last sale date: 1 October 2025. Months with sales: 22, a span of 639 days. The calendar contrast: [Last Calendar Date] returns 31 December 2025 — the calendar runs to the end of 2025, two months past the last sale — so a last-date question must be asked of the sales column, not the calendar column.
Download the data and the measures: the sales file (CSV) (66 rows) and the measures file (DAX) (the five measures below, ready to paste). The data is a constructed sample — three product lines, monthly revenue from January 2024 to October 2025 — not a real company's sales.
What you need
- Power BI Desktop on Windows. Desktop is a Windows application; there is no macOS or Linux version, and no headless runner.
- The sample file the sales file (CSV): columns
Month,Category,Units, andRevenue. One row per category per month, 66 rows. - Nothing else. No database, no service, no account.
1. Import the sales file
In Power BI Desktop, go to Home > Get data > Text/CSV, pick the sales file, and choose Load. Check the column types after loading: Month must be a date, Revenue a decimal number, and Units a whole number. If Month loads as text, the relationship in step 3 will not work — change the type in Power Query first.
2. Build the calendar table
Time-intelligence functions need a date table: a table with one row per day, continuous, with no gaps. Microsoft's documentation says to mark one of the tables containing a date column as the date table before using time-intelligence functions (Microsoft Learn: Set and use date tables in Power BI Desktop). Create it as a calculated table:
Calendar =
ADDCOLUMNS (
    CALENDAR ( DATE ( 2024, 1, 1 ), DATE ( 2025, 12, 31 ) ),
    "Year", YEAR ( [Date] ),
    "MonthNumber", MONTH ( [Date] ),
    "MonthName", FORMAT ( [Date], "mmmm" ),
    "Quarter", "Q" & FORMAT ( [Date], "Q" ),
    "MonthYear", FORMAT ( [Date], "mmm yyyy" )
)
CALENDAR on its own returns a table with a single Date column. ADDCOLUMNS adds the columns the visuals need: Year and MonthNumber as numbers, MonthName as the full month name, Quarter as Q1 to Q4, and MonthYear as a label such as Jan 2025. Marking the table as the date table removes the built-in date hierarchies Desktop would otherwise generate. Build one by hand instead: in the Fields pane, right-click Year and choose Add to hierarchy > New hierarchy. Then drag Quarter and MonthName in below Year, in that order. Then sort the months in calendar order: select MonthName and choose Sort by column > MonthNumber on the Column tools ribbon. The full treatment is in Build a Power BI date table in DAX.
Then mark it: select the Calendar table in the Fields pane, right-click, and choose Mark as date table > Mark as date table, with Date as the date column. The same Learn page describes both the right-click path and the Table tools ribbon path. The range must cover every month in the sales file — January 2024 through October 2025 — and in this guide it deliberately runs past the last sale, to 31 December 2025, which is what makes the contrast in step 4 visible.
3. Relate the two tables
In Model view, drag Calendar[Date] onto Sales[Month]. The relationship is one-to-many, single direction, from Calendar to Sales. One calendar date matches many sales rows; no sales row matches more than one calendar date. If the relationship shows as many-to-many or inactive, the Month column is the wrong type — go back to step 1 and fix it.
4. Write the five measures
Create each measure on the Sales table (Modeling > New measure). The measures file (DAX) holds the same five measures, ready to paste.
First Sale Date =
FIRSTDATE (
    Sales[Month]
)

Last Sale Date =
LASTDATE (
    Sales[Month]
)

Months With Sales =
DISTINCTCOUNT (
    Sales[Month]
)

Sales Span Days =
DATEDIFF (
    [First Sale Date],
    [Last Sale Date],
    DAY
)

Last Calendar Date =
LASTDATE (
    Calendar[Date]
)
How it works: FIRSTDATE returns the first date in the current context (Microsoft Learn, FIRSTDATE function (DAX)), and LASTDATE returns the last date in the current context (Microsoft Learn, LASTDATE function (DAX)). Pointed at Sales[Month], the context is the set of months that actually have sales rows, so the pair returns the first and last sale dates. DISTINCTCOUNT counts the distinct values of the sales month column in context, which is the number of months with sales. DATEDIFF returns the number of interval boundaries between two dates, here the day count between the first and last sale dates (Microsoft Learn, DATEDIFF function (DAX)).
The fifth measure is the contrast, not an answer about sales. [Last Calendar Date] asks the same last-date function about Calendar[Date], and it returns 31 December 2025, because the calendar table runs to the end of 2025 — two months past the last sale. On the first-date side the two columns happen to agree: the same function on Calendar[Date] with no filters also returns 1 January 2024, the calendar start, which happens to match the first sale. Only the last-date side differs. That agreement at the start is exactly why the trap below is easy to fall into: one matching end makes the calendar column look like a safe place to ask both questions.
5. Put them in a visual
Add five card visuals, one each for [First Sale Date], [Last Sale Date], [Months With Sales], [Sales Span Days], and [Last Calendar Date]. Format the three date measures as dates in full — 1 October 2025, not a short form — so the calendar contrast is readable at a glance. Add a slicer on Calendar[Year]: with no year selected, the cards show the values for all dates; select 2025 in the slicer and the first three cards change to that year's first sale, last sale, and month count, which is the check table in the next step.
6. Check the numbers
Put Calendar[Year] on the rows of a table visual, with [First Sale Date], [Last Sale Date], and [Months With Sales] as the values, and show totals. The total row is the all-dates row. Every row must match this table:
| Period | First Sale Date | Last Sale Date | Months With Sales |
|---|---|---|---|
| 2024 | 1 January 2024 | 1 December 2024 | 12 |
| 2025 | 1 January 2025 | 1 October 2025 | 10 |
| All dates | 1 January 2024 | 1 October 2025 | 22 |
Then clear every filter and read the other two cards: [Sales Span Days] shows 639, and [Last Calendar Date] shows 31 December 2025. One plain fact about this file: every category shares the same first and last dates. Each of Desks, Chairs, and Lamps has a row in all 22 months, so a category slicer changes none of the dates in the check table — it only restates them per category.
Traps
TRAP — ASKING THE CALENDAR WHEN SALES ENDED. The calendar table runs to 31 December 2025 by design, whether or not anything sold in November or December. A last-date measure pointed at Calendar[Date] therefore answers 31 December 2025 — a date with no sales on it — and a report that calls that the last sale date overstates the selling period by two months. Ask the sales column for sale dates; keep the calendar version, as this guide does, only as a labelled contrast.
TRAP — THE FIRST DATE MATCHES, SO THE CALENDAR LOOKS SAFE. At the start of the file the two columns agree: the calendar starts on 1 January 2024 and the first sale is also 1 January 2024. That match is a property of how this calendar was built, not evidence that the calendar column answers sale questions. Only the last-date side differs here, but on a file where sales start after the calendar start, both ends would differ.
TRAP — THE DATES ARE MONTH STARTS BECAUSE THE FILE IS MONTHLY. Every value in the sales month column is the first of a month, so the first and last sale dates come back as 1 January 2024 and 1 October 2025. The measures return the first and last dates present in the column, nothing finer. On a file with one row per sale, the same measures return the actual days of the first and last sales.
TRAP — A YEAR FILTER MOVES THE FIRST AND LAST DATES. Both functions work in the current context, so a Calendar[Year] slicer set to 2025 moves the first sale date to 1 January 2025 and the month count to 10. That is the behaviour the check table relies on, row by row — but a card left filtered that way no longer describes all dates. Read the headline values with the slicer clear.
End state
A calendar table marked as the date table, a one-to-many relationship to sales, and five measures. With no filters, the cards read: first sale 1 January 2024, last sale 1 October 2025, 22 months with sales, a span of 639 days, and a last calendar date of 31 December 2025 sitting beside the last sale date as a reminder of which column answers which question. The same five measures work on any sales table with a date column and a calendar table — only the table and column names change.
Sources
- Microsoft Learn, FIRSTDATE function (DAX) — returns the first date in the current context
- Microsoft Learn, LASTDATE function (DAX) — returns the last date in the current context
- Microsoft Learn, DATEDIFF function (DAX) — returns the number of interval boundaries between two dates
- Microsoft Learn — Set and use date tables in Power BI Desktop — when a date table must be marked, and how to mark it
Written November 12, 2026