Power BI prior-quarter sales in DAX: DATEADD shifted one quarter back
Comparing a month with the month before it answers “are we up on last month?” Comparing it with the same month one quarter earlier answers a different question: “are we up on where the year stood a quarter ago?” — a comparison that steps over the noise of the two months in between. This guide builds that comparison with four measures: a total, the same total shifted one quarter back with DATEADD, and the change between them, in dollars and in percent. The headline result: October 2025 sales of $13,436.42 against $12,184.22 in July 2025, up $1,252.20 (+10.28%).
Key result: In October 2025, revenue was $13,436.42, against $12,184.22 for its prior-quarter month, July 2025 — up $1,252.20 (+10.28%). In a quarter-level visual the same measure returns the whole prior quarter: the third quarter of 2025 reads a prior-quarter figure of $37,082.95, the second quarter's total.
Download the data and the measures: the sales file (CSV) (66 rows) and the measures file (DAX) (the four measures below, ready to paste). The data is a constructed sample — three product lines, monthly revenue from January 2024 to October 2025 — not a real company's sales.
What you need
- Power BI Desktop on Windows. Desktop is a Windows application; there is no macOS or Linux version, and no headless runner.
- The sample file the sales file (CSV): columns
Month,Category,Units, andRevenue. One row per category per month, 66 rows. - Nothing else. No database, no service, no account.
1. Import the sales file
In Power BI Desktop, go to Home > Get data > Text/CSV, pick the sales file, and choose Load. Check the column types after loading: Month must be a date, Revenue a decimal number, and Units a whole number. If Month loads as text, the relationship in step 3 will not work — change the type in Power Query first.
2. Build the calendar table
Time-intelligence functions need a date table: a table with one row per day, continuous, with no gaps. Microsoft's documentation says to mark one of the tables containing a date column as the date table before using time-intelligence functions (Microsoft Learn: Set and use date tables in Power BI Desktop). Create it as a calculated table:
Calendar =
ADDCOLUMNS (
    CALENDAR ( DATE ( 2024, 1, 1 ), DATE ( 2025, 12, 31 ) ),
    "Year", YEAR ( [Date] ),
    "MonthNumber", MONTH ( [Date] ),
    "MonthName", FORMAT ( [Date], "mmmm" ),
    "Quarter", "Q" & FORMAT ( [Date], "Q" ),
    "MonthYear", FORMAT ( [Date], "mmm yyyy" )
)
CALENDAR on its own returns a table with a single Date column. ADDCOLUMNS adds the columns the visuals need: Year and MonthNumber as numbers, MonthName as the full month name, Quarter as Q1 to Q4, and MonthYear as a label such as Jan 2025. Marking the table as the date table removes the built-in date hierarchies Desktop would otherwise generate. Build one by hand instead: in the Fields pane, right-click Year and choose Add to hierarchy > New hierarchy. Then drag Quarter and MonthName in below Year, in that order. Then sort the months in calendar order: select MonthName and choose Sort by column > MonthNumber on the Column tools ribbon. The full treatment is in Build a Power BI date table in DAX.
Then mark it: select the Calendar table in the Fields pane, right-click, and choose Mark as date table > Mark as date table, with Date as the date column. The same Learn page describes both the right-click path and the Table tools ribbon path. The range must cover every month in the sales file — January 2024 through October 2025 — or the prior-quarter lookup in step 4 returns blank for the uncovered months.
3. Relate the two tables
In Model view, drag Calendar[Date] onto Sales[Month]. The relationship is one-to-many, single direction, from Calendar to Sales. One calendar date matches many sales rows; no sales row matches more than one calendar date. If the relationship shows as many-to-many or inactive, the Month column is the wrong type — go back to step 1 and fix it.
4. Write the four measures
Create each measure on the Sales table (Modeling > New measure). The measures file (DAX) holds the same four measures, ready to paste.
Total Sales = SUM ( Sales[Revenue] )

Sales PQ =
CALCULATE (
    [Total Sales],
    DATEADD (
        Calendar[Date],
        -1,
        QUARTER
    )
)

Change vs PQ = [Total Sales] - [Sales PQ]

PQ % Change =
DIVIDE (
    [Total Sales] - [Sales PQ],
    [Sales PQ]
)
How it works: DATEADD “returns a table of dates shifted forward or backward by the specified number of intervals” (Microsoft Learn, DATEADD function (DAX)) — here one quarter back. CALCULATE evaluates [Total Sales] under that shifted context (Microsoft Learn, CALCULATE function (DAX)), and DIVIDE turns the change into a percentage, returning blank instead of an error when the prior quarter is empty (Microsoft Learn, DIVIDE function (DAX)). The shift applies to the whole current context, not to a single month: in a month row, October 2025 reads July 2025; in a quarter row, the third quarter of 2025 reads the whole second quarter, $37,082.95. One measure answers both questions because the context decides what gets shifted.
DATEADD requires the dates in context to form a contiguous interval, which is what the calendar table in step 2 supplies — one row per day, no gaps. The first quarter of the file has no prior quarter to shift to: January to March 2024 sit at the start of the sales range, so [Sales PQ] is blank there in sales terms, even though the calendar covers those months, and the two change measures are blank with it.
5. Put them in a visual
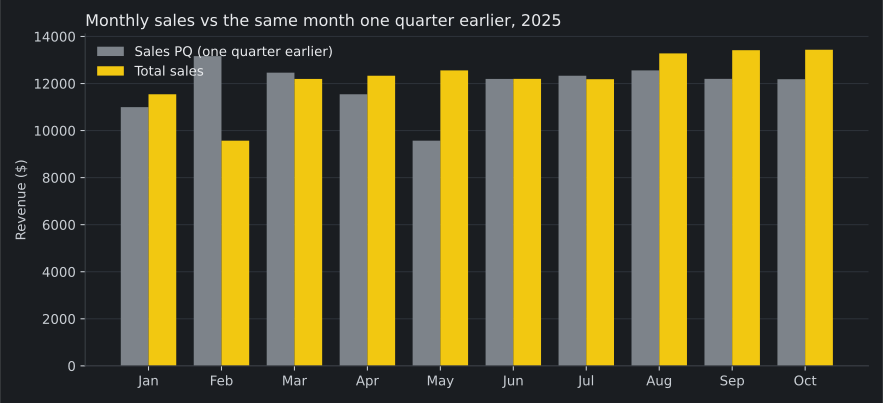
Add a clustered column chart. Put the Calendar hierarchy (Year > Quarter > MonthName) on the x-axis and drill to the month level. Use [Total Sales] and [Sales PQ] as the values, and add a card visual showing [PQ % Change] formatted as a percentage with two decimals. Filter the chart to 2025 with a slicer on Calendar[Year] if you want the current-year view only; the prior-quarter bars still compute, because the shift happens inside the measure, not in the visual filter.
6. Check the numbers
Put the Calendar hierarchy (Year > Quarter > MonthName), drilled to the month level, [Total Sales], [Sales PQ], [Change vs PQ], and [PQ % Change] in a table visual. Every row must match this table:
| Month | Total Sales ($) | Sales PQ ($) | Change vs PQ ($) | PQ % Change |
|---|---|---|---|---|
| January 2025 | 11,542.57 | 10,994.74 | +547.83 | +4.98% |
| February 2025 | 9,571.47 | 13,163.44 | −3,591.97 | −27.29% |
| March 2025 | 12,194.25 | 12,461.76 | −267.51 | −2.15% |
| April 2025 | 12,329.83 | 11,542.57 | +787.26 | +6.82% |
| May 2025 | 12,556.42 | 9,571.47 | +2,984.95 | +31.19% |
| June 2025 | 12,196.70 | 12,194.25 | +2.45 | +0.02% |
| July 2025 | 12,184.22 | 12,329.83 | −145.61 | −1.18% |
| August 2025 | 13,279.99 | 12,556.42 | +723.57 | +5.76% |
| September 2025 | 13,415.30 | 12,196.70 | +1,218.60 | +9.99% |
| October 2025 | 13,436.42 | 12,184.22 | +1,252.20 | +10.28% |
| Jan–Oct 2025 | 122,707.17 | — | — | — |
If a 2025 month shows a blank [Sales PQ], the calendar table is the suspect: either it was not marked as the date table, or its range does not cover the prior quarter. If [Sales PQ] equals [Total Sales] on every row, the shift is missing — check that DATEADD sits inside the CALCULATE call with -1, QUARTER.
Traps
TRAP — READING A QUARTER AS A MONTH. [Sales PQ] shifts whatever the visual puts in context. In a month visual, October 2025 reads July 2025 — one month. In a quarter visual, the third quarter of 2025 reads the whole second quarter, $37,082.95 — three months at once. Neither is wrong, but quoting the quarter figure as a monthly comparison, or the other way around, misstates the change by a factor of three.
TRAP — A CALENDAR WITH GAPS BREAKS THE SHIFT. DATEADD requires the dates in context to form a contiguous interval. A calendar built from the sales file's own months — one row per month, nothing in between — gives the shift nothing continuous to move along. Build one row per day, with no gaps, as in step 2.
TRAP — A PERCENTAGE WITH NO PRIOR QUARTER. The first quarter of a file has nothing to compare against, so [Sales PQ] is blank there. DIVIDE returns blank for the percentage in that case. Writing the percentage with the division operator instead leaves the blank handling to the operator — use DIVIDE and let the empty quarter read as empty.
End state
A calendar table marked as the date table, a one-to-many relationship to sales, and four measures. The table visual shows ten months of 2025 against the same month one quarter earlier: the change ran from −27.29% in February to +31.19% in May, and October closed at +10.28% — $13,436.42 against $12,184.22. Put the same measures in a quarter-level visual and the comparison widens to whole quarters, with the third quarter of 2025 measured against a prior quarter of $37,082.95. The same four measures work on any sales table with a date column and a calendar table — only the table and column names change.
Sources
- Microsoft Learn, DATEADD function (DAX) — returns a table of dates shifted forward or backward by the specified number of intervals; the dates in context must form a contiguous interval
- Microsoft Learn, CALCULATE function (DAX) — evaluates an expression in a modified filter context
- Microsoft Learn, DIVIDE function (DAX) — performs division and returns BLANK() on division by zero
- Microsoft Learn — Set and use date tables in Power BI Desktop — when a date table must be marked, and how to mark it
Written November 12, 2026