Power BI year-to-date sales in DAX: TOTALYTD and YTD versus last year
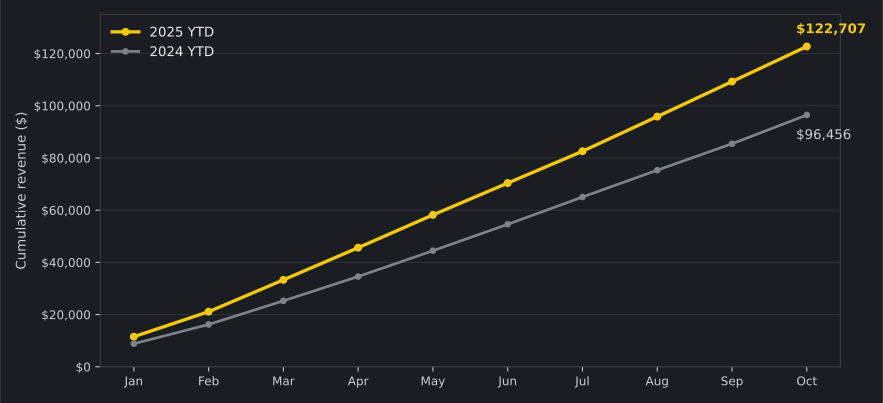
“How are we doing so far this year?” is a different question from “how did this month do?” A monthly figure tells you October; a year-to-date figure tells you the year so far, and comparing it with the same stretch last year tells you whether the year is actually ahead. This guide builds that comparison with four measures: a total, a year-to-date total with TOTALYTD, the same total shifted one year back, and the change between them. The headline result: year-to-date sales through October 2025 of $122,707.17 against $96,456.39 for the same months in 2024, up 27.22%.
Key result: Sales year to date through October 2025: $122,707.17, against $96,456.39 for January–October 2024 — YTD YoY +27.22%. October 2025 alone: $13,436.42, with a year-to-date total at the end of September of $109,270.75.
Download the data and the measures: the sales file (CSV) (66 rows, MD5 51a16fd9e023dd0208564a0c2c1a089e) and the measures file (DAX) (the four measures below, ready to paste). The data is a constructed sample — three product lines, monthly revenue from January 2024 to October 2025 — not a real company's sales.
What you need
- Power BI Desktop on Windows. Desktop is a Windows application; there is no macOS or Linux version, and no headless runner.
- The sample file the sales file (CSV): columns
Month,Category,Units, andRevenue. One row per category per month, 66 rows. - Nothing else. No database, no service, no account.
1. Import the sales file
In Power BI Desktop, go to Home > Get data > Text/CSV, pick the sales file, and choose Load. Check the column types after loading: Month must be a date, Revenue a decimal number, and Units a whole number. If Month loads as text, the relationship in step 3 will not work — change the type in Power Query first.
2. Build the calendar table
Time-intelligence functions need a date table: a table with one row per day, continuous, with no gaps. Microsoft's documentation says to mark one of the tables containing a date column as the date table before using time-intelligence functions (Microsoft Learn: Set and use date tables in Power BI Desktop). Create it as a calculated table:
Calendar =
ADDCOLUMNS (
    CALENDAR ( DATE ( 2024, 1, 1 ), DATE ( 2025, 12, 31 ) ),
    "Year", YEAR ( [Date] ),
    "MonthNumber", MONTH ( [Date] ),
    "MonthName", FORMAT ( [Date], "mmmm" ),
    "Quarter", "Q" & FORMAT ( [Date], "Q" ),
    "MonthYear", FORMAT ( [Date], "mmm yyyy" )
)
CALENDAR on its own returns a table with a single Date column. ADDCOLUMNS adds the columns the visuals need: Year and MonthNumber as numbers, MonthName as the full month name, Quarter as Q1 to Q4, and MonthYear as a label such as Jan 2025. Marking the table as the date table removes the built-in date hierarchies Desktop would otherwise generate. Build one by hand instead: in the Fields pane, right-click Year and choose Add to hierarchy > New hierarchy. Then drag Quarter and MonthName in below Year, in that order. Then sort the months in calendar order: select MonthName and choose Sort by column > MonthNumber on the Column tools ribbon. The full treatment is in Build a Power BI date table in DAX.
Then mark it: select the Calendar table in the Fields pane, right-click, and choose Mark as date table > Mark as date table, with Date as the date column. The same Learn page describes both the right-click path and the Table tools ribbon path. The range must cover every month in the sales file — January 2024 through October 2025 — or the prior-year lookup in step 4 returns blank for the uncovered months.
3. Relate the two tables
In Model view, drag Calendar[Date] onto Sales[Month]. The relationship is one-to-many, single direction, from Calendar to Sales. One calendar date matches many sales rows; no sales row matches more than one calendar date. If the relationship shows as many-to-many or inactive, the Month column is the wrong type — go back to step 1 and fix it.
4. Write the four measures
Create each measure on the Sales table (Modeling > New measure). The measures file (DAX) holds the same four measures, ready to paste.
Total Sales = SUM ( Sales[Revenue] )

Sales YTD =
TOTALYTD (
    [Total Sales],
    Calendar[Date]
)

Sales YTD PY =
CALCULATE (
    [Sales YTD],
    SAMEPERIODLASTYEAR ( Calendar[Date] )
)

YTD YoY % Change =
DIVIDE (
    [Sales YTD] - [Sales YTD PY],
    [Sales YTD PY]
)
How it works: TOTALYTD evaluates the expression for the year to date — from 1 January through the latest date in the current filter (Microsoft Learn, TOTALYTD function (DAX)). Sales YTD PY reevaluates that year-to-date measure under dates moved one year back. SAMEPERIODLASTYEAR returns the current context shifted one year back, which Microsoft documents as equivalent to DATEADD(dates, -1, year) (Microsoft Learn, SAMEPERIODLASTYEAR function (DAX)). CALCULATE evaluates the measure under that shifted context (Microsoft Learn, CALCULATE function (DAX)). DIVIDE returns blank instead of an error when the prior-year total is zero or blank (Microsoft Learn, DIVIDE function (DAX)).
Year to date is not the same as a running total. The running total in the running-total guide accumulates over whatever dates the slicers leave visible: filter to 2025 and it restarts at January, but with no year filter it carries 2024 into 2025 and keeps climbing. TOTALYTD always resets on 1 January, whatever the filter — that reset is the point of the measure. Use the running total when the question is “everything up to now”; use year to date when the question is “this year so far, against last year so far”.
5. Put them in a visual
Add a line chart. Put the Calendar hierarchy (Year > Quarter > MonthName) on the x-axis and drill to the month level. Use [Sales YTD] and [Sales YTD PY] as the values, and add a card visual showing [YTD YoY % Change] formatted as a percentage with two decimals. Filter the chart to 2025 if you want the current-year view only; the prior-year line still computes, because the shift happens inside the measure, not in the visual filter.
6. Check the numbers
Put the Calendar hierarchy (Year > Quarter > MonthName), drilled to the month level, [Total Sales], [Sales YTD], [Sales YTD PY], and [YTD YoY % Change] in a table visual. Every row must match this table, which was computed independently from the same CSV:
| Month | Total Sales ($) | Sales YTD ($) | Sales YTD PY ($) | YTD YoY % |
|---|---|---|---|---|
| January 2025 | 11,542.57 | 11,542.57 | 8,851.91 | +30.40% |
| February 2025 | 9,571.47 | 21,114.04 | 16,219.79 | +30.17% |
| March 2025 | 12,194.25 | 33,308.29 | 25,274.89 | +31.78% |
| April 2025 | 12,329.83 | 45,638.12 | 34,574.88 | +32.00% |
| May 2025 | 12,556.42 | 58,194.54 | 44,479.00 | +30.84% |
| June 2025 | 12,196.70 | 70,391.24 | 54,586.84 | +28.95% |
| July 2025 | 12,184.22 | 82,575.46 | 65,043.95 | +26.95% |
| August 2025 | 13,279.99 | 95,855.45 | 75,328.99 | +27.25% |
| September 2025 | 13,415.30 | 109,270.75 | 85,461.65 | +27.86% |
| October 2025 | 13,436.42 | 122,707.17 | 96,456.39 | +27.22% |
| Jan–Oct 2025 | 122,707.17 | 122,707.17 | 96,456.39 | +27.22% |
If a month shows a blank Sales YTD PY, the calendar table is the suspect: either it was not marked as the date table, or its range does not cover the prior year. If Sales YTD equals Total Sales on every row, the measure is not accumulating — check that the date argument is Calendar[Date], not the sales table's own Month column.
Traps
TRAP — SHIFTING THE MONTH, NOT THE YEAR TO DATE. Writing CALCULATE ( [Total Sales], SAMEPERIODLASTYEAR ( Calendar[Date] ) ) gives the single month a year ago, not the prior year to date. Shift the year-to-date measure itself instead: CALCULATE ( [Sales YTD], SAMEPERIODLASTYEAR ( Calendar[Date] ) ). The check table catches this at once — January's prior-year figure would read $8,851.91 either way, but February's would read $7,367.88 instead of $16,219.79.
TRAP — NO DATE TABLE, NO YEAR TO DATE. TOTALYTD against the sales table's own Month column returns blank, not an error, because the function needs a continuous date column to define the year. Build and mark the calendar table first, as in step 2.
TRAP — THE YEAR ENDS WHEN YOUR YEAR ENDS. TOTALYTD defaults to a 31 December year end. If your fiscal year ends on 30 June, the measure accumulates from 1 July, not 1 January — pass the year-end date as the fourth argument. The reference documents the parameter as a literal string such as "6/30", with the year portion ignored (Microsoft Learn, TOTALYTD function (DAX)).
TRAP — DIVIDE BY A BLANK PRIOR YEAR. Writing ([Sales YTD] - [Sales YTD PY]) / [Sales YTD PY] with the division operator errors on months with no prior-year sales. DIVIDE returns blank instead. The first year of any new product line is exactly that case.
End state
A calendar table marked as the date table, a one-to-many relationship to sales, and four measures. The table visual shows ten months of 2025 with the year-to-date total climbing from $11,542.57 in January to $122,707.17 in October, against $96,456.39 for the same stretch in 2024 — the year-to-date change between 26.95% and 32.00% in every month, ending at +27.22%. The same four measures work on any sales table with a date column and a calendar table — only the table and column names change.
Sources
- Microsoft Learn, TOTALYTD function (DAX) — evaluates the year-to-date value of the expression in the current context; default year end 31 December
- Microsoft Learn, SAMEPERIODLASTYEAR function (DAX) — shifts the dates in the current context one year back; equivalent to DATEADD(dates, -1, year)
- Microsoft Learn, DIVIDE function (DAX) — performs division and returns BLANK() on division by zero
- Microsoft Learn, CALCULATE function (DAX) — evaluates an expression in a modified filter context
- Microsoft Learn — Set and use date tables in Power BI Desktop — when a date table must be marked, and how to mark it
- Microsoft Learn, Use DAX time intelligence functions — TOTALYTD and the date-table requirement, built the same way
Checked 11 November 2026. The measure results in the check table were computed in Python 3.12.3 with pandas 2.1.4 by cumulative-summing the same sales file by month within each year and shifting one year back — the identical aggregations the DAX performs. Year to date through October 2025: $122,707.17 vs $96,456.39, +27.22%. Run the check table against your own report; if a row disagrees, the model differs from the one described above.