Power BI quarter-over-quarter change in DAX: this quarter against last quarter
A quarter is long enough for a trend to mean something and short enough to act on. This guide builds the quarter-over-quarter comparison with three measures: a total, the same total shifted one quarter back, and the change between them. The context is quarter-level throughout, so each figure is a whole quarter set against the whole quarter before it. The headline result: Q3 2025 sales of $38,879.51 against $37,082.95 in Q2 2025, up 4.84% — the last complete quarter in the file.
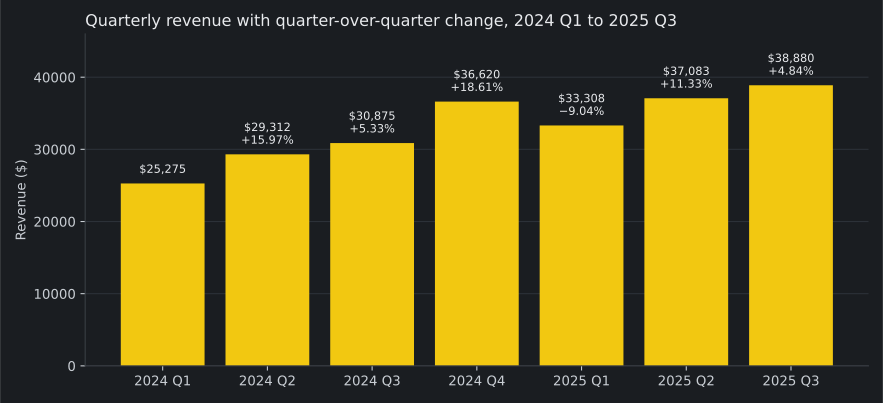
Key result: Q3 2025: $38,879.51, against Q2 2025: $37,082.95 — quarter-over-quarter change +4.84%, and Q3 2025 is the last complete quarter in the file. Q1 2025 is the only down quarter on a full-quarter basis: $33,308.29 against $36,619.94 in Q4 2024, −9.04%.
Download the data and the measures: the sales file (CSV) (66 rows) and the measures file (DAX) (the three measures below, ready to paste). The data is a constructed sample — three product lines, monthly revenue from January 2024 to October 2025 — not a real company's sales.
What you need
- Power BI Desktop on Windows. Desktop is a Windows application; there is no macOS or Linux version, and no headless runner.
- The sample file the sales file (CSV): columns
Month,Category,Units, andRevenue. One row per category per month, 66 rows. - Nothing else. No database, no service, no account.
1. Import the sales file
In Power BI Desktop, go to Home > Get data > Text/CSV, pick the sales file, and choose Load. Check the column types after loading: Month must be a date, Revenue a decimal number, and Units a whole number. If Month loads as text, the relationship in step 3 will not work — change the type in Power Query first.
2. Build the calendar table
Time-intelligence functions need a date table: a table with one row per day, continuous, with no gaps. Microsoft's documentation says to mark one of the tables containing a date column as the date table before using time-intelligence functions (Microsoft Learn: Set and use date tables in Power BI Desktop). Create it as a calculated table:
Calendar =
ADDCOLUMNS (
    CALENDAR ( DATE ( 2024, 1, 1 ), DATE ( 2025, 12, 31 ) ),
    "Year", YEAR ( [Date] ),
    "MonthNumber", MONTH ( [Date] ),
    "MonthName", FORMAT ( [Date], "mmmm" ),
    "Quarter", "Q" & FORMAT ( [Date], "Q" ),
    "MonthYear", FORMAT ( [Date], "mmm yyyy" )
)
CALENDAR on its own returns a table with a single Date column. ADDCOLUMNS adds the columns the visuals need: Year and MonthNumber as numbers, MonthName as the full month name, Quarter as Q1 to Q4, and MonthYear as a label such as Jan 2025. Marking the table as the date table removes the built-in date hierarchies Desktop would otherwise generate. Build one by hand instead: in the Fields pane, right-click Year and choose Add to hierarchy > New hierarchy. Then drag Quarter and MonthName in below Year, in that order. Then sort the months in calendar order: select MonthName and choose Sort by column > MonthNumber on the Column tools ribbon. The full treatment is in Build a Power BI date table in DAX.
Then mark it: select the Calendar table in the Fields pane, right-click, and choose Mark as date table > Mark as date table, with Date as the date column. The same Learn page describes both the right-click path and the Table tools ribbon path. The range must cover every month in the sales file — January 2024 through October 2025 — or the prior-quarter lookup in step 4 returns blank for the uncovered months.
3. Relate the two tables
In Model view, drag Calendar[Date] onto Sales[Month]. The relationship is one-to-many, single direction, from Calendar to Sales. One calendar date matches many sales rows; no sales row matches more than one calendar date. If the relationship shows as many-to-many or inactive, the Month column is the wrong type — go back to step 1 and fix it.
4. Write the three measures
Create each measure on the Sales table (Modeling > New measure). The measures file (DAX) holds the same three measures, ready to paste.
Total Sales = SUM ( Sales[Revenue] )

Sales PQ =
CALCULATE (
    [Total Sales],
    DATEADD ( Calendar[Date], -1, QUARTER )
)

QoQ % Change =
DIVIDE (
    [Total Sales] - [Sales PQ],
    [Sales PQ]
)
How it works: the visual in steps 5 and 6 is quarter-level — its rows are Calendar[Year] and Calendar[Quarter] — so in that context [Total Sales] is a full quarter, not a month. DATEADD returns the dates in the current context shifted by the given number of intervals, here one quarter back (Microsoft Learn, DATEADD function (DAX)). CALCULATE evaluates [Total Sales] under that shifted context, so [Sales PQ] is the whole prior quarter (Microsoft Learn, CALCULATE function (DAX)). DIVIDE returns blank instead of an error when the prior quarter is blank (Microsoft Learn, DIVIDE function (DAX)). If you want the prior quarter as a dollar figure on its own, the prior-quarter guide is the companion to this one: it builds that total, and this guide turns it into a percentage change.
5. Put them in a visual
Add a clustered column chart. Put the Calendar hierarchy (Year > Quarter > MonthName) on the x-axis and drill to the Quarter level. Use [Total Sales] as the value, and add a card visual showing [QoQ % Change] formatted as a percentage with two decimals. Keep the chart at quarter level: the same measures dropped into a month-level visual answer a different question, as the traps below explain.
6. Check the numbers
Put Calendar[Year] and Calendar[Quarter] on the rows of a table visual, with [Total Sales], [Sales PQ], and [QoQ % Change] as the values. Every row must match this table:
| Quarter | Total Sales ($) | Sales PQ ($) | QoQ % Change |
|---|---|---|---|
| 2024 Q1 | 25,274.89 | — | — |
| 2024 Q2 | 29,311.95 | 25,274.89 | +15.97% |
| 2024 Q3 | 30,874.81 | 29,311.95 | +5.33% |
| 2024 Q4 | 36,619.94 | 30,874.81 | +18.61% |
| 2025 Q1 | 33,308.29 | 36,619.94 | −9.04% |
| 2025 Q2 | 37,082.95 | 33,308.29 | +11.33% |
| 2025 Q3 | 38,879.51 | 37,082.95 | +4.84% |
| 2025 Q4 (October only) | 13,436.42 | 38,879.51 | −65.44% |
The last row is a partial quarter, not a collapse: the file ends in October, so Q4 2025 holds one month against a full prior quarter. Read the run of complete quarters instead — growth in every quarter except Q1 2025, which fell 9.04% against Q4 2024. If the first quarter shows a percentage instead of a blank, the shift is reaching outside the calendar range; if a quarter shows a blank prior quarter in the middle of the table, the calendar table is the suspect: either it was not marked as the date table, or its range has a gap.
Traps
TRAP — A PARTIAL QUARTER READS AS A COLLAPSE. Q4 2025 shows −65.44%, and that number is arithmetic, not a result. The file ends in October, so the quarter holds one month of sales set against the full three months of Q3 2025. Any quarter-over-quarter table that includes a quarter still in progress — or a first quarter cut short by the start of the file — prints the same false collapse. Compare complete quarters, and label a partial quarter as partial wherever it appears.
TRAP — THE MEASURES IN A MONTH-LEVEL VISUAL. These measures take their meaning from the context the visual gives them. At quarter level, the shift moves a whole quarter. At month level, the same shift moves one month of dates back one quarter, so [Sales PQ] becomes the single month three months earlier and the change compares two single months. Nothing errors; the numbers just stop answering the quarter question. Keep the rows at Calendar[Year] and Calendar[Quarter], or the Calendar hierarchy drilled to the Quarter level.
TRAP — NO DATE TABLE, NO SHIFT. The shift function needs a continuous date column to move along. Against the sales table's own Month column the prior quarter comes back blank or wrong, because that column holds one date per month with gaps between them. Build and mark the calendar table first, as in step 2.
TRAP — DIVIDE BY A BLANK PRIOR QUARTER. Writing ([Total Sales] - [Sales PQ]) / [Sales PQ] with the division operator errors on the first quarter, which has no prior quarter. DIVIDE returns blank instead, which is the right answer for 2024 Q1 in the check table.
End state
A calendar table marked as the date table, a one-to-many relationship to sales, and three measures. The table visual shows eight quarters: the prior-quarter figure blank for 2024 Q1, then a change for every quarter after it — up 15.97%, 5.33%, and 18.61% through 2024, down 9.04% in Q1 2025, then up 11.33% and 4.84%, with the partial Q4 2025 row labelled for what it is. The same three measures work on any sales table with a date column and a calendar table — only the table and column names change.
Sources
- Microsoft Learn, DATEADD function (DAX) — returns a set of dates shifted by the given number of intervals, here one quarter back
- Microsoft Learn, DIVIDE function (DAX) — performs division and returns BLANK() on division by zero
- Microsoft Learn, CALCULATE function (DAX) — evaluates an expression in a modified filter context
- Microsoft Learn — Set and use date tables in Power BI Desktop — when a date table must be marked, and how to mark it
Written November 12, 2026