Power BI rolling 12-month total in DAX: DATESINPERIOD that moves every month
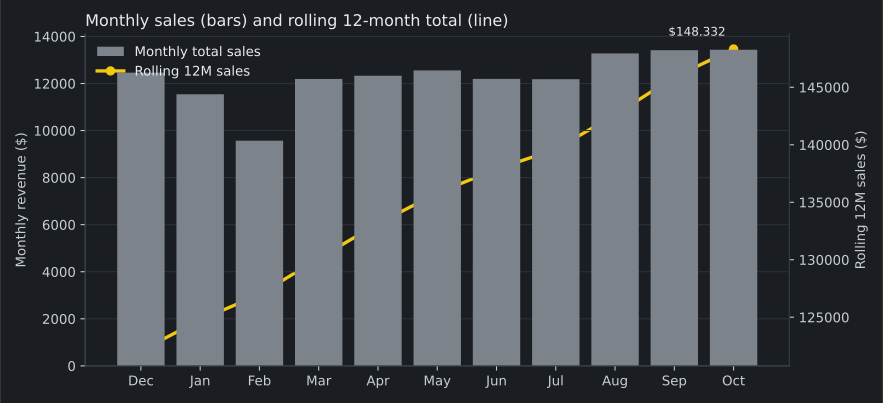
A single month answers “how did October do?” A rolling 12-month total answers a steadier question: “how did the last year do, ending now?” Every month the window moves with the report — the oldest month drops out, the newest month drops in — so the total is never distorted by which part of the year you happen to be in. This guide builds that total with three measures: a total, a rolling 12-month total with DATESINPERIOD, and its monthly average. The headline result: the 12 months ending October 2025 total $148,332.37, a monthly average of $12,361.03, and the first full 12-month window, ending December 2024, totals $122,081.59.
Key result: The rolling 12 months to October 2025 total $148,332.37, a monthly average of $12,361.03. The first full 12-month window, ending December 2024, totals $122,081.59. October 2025 alone: $13,436.42.
Download the data and the measures: the sales file (CSV) (66 rows) and the measures file (DAX) (the three measures below, ready to paste). The data is a constructed sample — three product lines, monthly revenue from January 2024 to October 2025 — not a real company's sales.
What you need
- Power BI Desktop on Windows. Desktop is a Windows application; there is no macOS or Linux version, and no headless runner.
- The sample file the sales file (CSV): columns
Month,Category,Units, andRevenue. One row per category per month, 66 rows. - Nothing else. No database, no service, no account.
1. Import the sales file
In Power BI Desktop, go to Home > Get data > Text/CSV, pick the sales file, and choose Load. Check the column types after loading: Month must be a date, Revenue a decimal number, and Units a whole number. If Month loads as text, the relationship in step 3 will not work — change the type in Power Query first.
2. Build the calendar table
Time-intelligence functions need a date table: a table with one row per day, continuous, with no gaps. Microsoft's documentation says to mark one of the tables containing a date column as the date table before using time-intelligence functions (Microsoft Learn: Set and use date tables in Power BI Desktop). Create it as a calculated table:
Calendar =
ADDCOLUMNS (
    CALENDAR ( DATE ( 2024, 1, 1 ), DATE ( 2025, 12, 31 ) ),
    "Year", YEAR ( [Date] ),
    "MonthNumber", MONTH ( [Date] ),
    "MonthName", FORMAT ( [Date], "mmmm" ),
    "Quarter", "Q" & FORMAT ( [Date], "Q" ),
    "MonthYear", FORMAT ( [Date], "mmm yyyy" )
)
CALENDAR on its own returns a table with a single Date column. ADDCOLUMNS adds the columns the visuals need: Year and MonthNumber as numbers, MonthName as the full month name, Quarter as Q1 to Q4, and MonthYear as a label such as Jan 2025. Marking the table as the date table removes the built-in date hierarchies Desktop would otherwise generate. Build one by hand instead: in the Fields pane, right-click Year and choose Add to hierarchy > New hierarchy. Then drag Quarter and MonthName in below Year, in that order. Then sort the months in calendar order: select MonthName and choose Sort by column > MonthNumber on the Column tools ribbon. The full treatment is in Build a Power BI date table in DAX.
Then mark it: select the Calendar table in the Fields pane, right-click, and choose Mark as date table > Mark as date table, with Date as the date column. The same Learn page describes both the right-click path and the Table tools ribbon path. The range must cover every month in the sales file — January 2024 through October 2025 — or the rolling window in step 4 cannot reach back a full 12 months for the early months.
3. Relate the two tables
In Model view, drag Calendar[Date] onto Sales[Month]. The relationship is one-to-many, single direction, from Calendar to Sales. One calendar date matches many sales rows; no sales row matches more than one calendar date. If the relationship shows as many-to-many or inactive, the Month column is the wrong type — go back to step 1 and fix it.
4. Write the three measures
Create each measure on the Sales table (Modeling > New measure). The measures file (DAX) holds the same three measures, ready to paste.
Total Sales = SUM ( Sales[Revenue] )

Rolling 12M Sales =
CALCULATE (
    [Total Sales],
    DATESINPERIOD (
        Calendar[Date],
        MAX ( Calendar[Date] ),
        -12,
        MONTH
    )
)

Rolling 12M Monthly Average =
DIVIDE (
    [Rolling 12M Sales],
    12
)
How it works: DATESINPERIOD returns a table of dates beginning from a start date and continuing for the specified number of intervals, and a negative count runs backward — the documentation says the function “returns a table of dates beginning from the latest date for the last year” in its example built on MAX (Microsoft Learn, DATESINPERIOD function (DAX)). In a month row, MAX ( Calendar[Date] ) is that month's last day — MAX returns the largest value in the column for the current context (Microsoft Learn, MAX function (DAX)) — so the window is the 12 calendar months ending with that month: October 2025 reads 1 November 2024 to 31 October 2025. The Learn example makes the same point with June 2020: a context whose latest date is 30 June 2020 returns 1 July 2019 to 30 June 2020. CALCULATE evaluates [Total Sales] over that window (Microsoft Learn, CALCULATE function (DAX)). DIVIDE then turns the total into a monthly average, dividing by 12 (Microsoft Learn, DIVIDE function (DAX)).
The window can only sum months that exist. The sales file starts in January 2024, so in 2024 before December the window holds fewer than 12 months of data — a figure in that stretch is a partial sum, not a 12-month total. The first full window is December 2024, and the check table in step 6 starts there. The same window at a shorter length is the engine behind the 3-month moving average in the month-over-month guide — three months back instead of twelve, averaged month by month instead of totalled.
5. Put them in a visual
Add a line and clustered column chart. Put the Calendar hierarchy (Year > Quarter > MonthName) on the x-axis and drill to the month level. Use [Total Sales] as the column values and [Rolling 12M Sales] as the line values, and add a card visual showing [Rolling 12M Monthly Average] formatted as currency with two decimals. The line moves slowly, because each new month replaces only one twelfth of it; the columns are the month itself. When the line keeps rising while the columns move up and down, the year as a whole is still growing.
6. Check the numbers
Put the Calendar hierarchy (Year > Quarter > MonthName), drilled to the month level, [Total Sales], [Rolling 12M Sales], and [Rolling 12M Monthly Average] in a table visual. Start the table at December 2024 — the first month with a full 12 months behind it. Every row must match this table:
| Month | Total Sales ($) | Rolling 12M Sales ($) | Rolling 12M Monthly Average ($) |
|---|---|---|---|
| December 2024 | 12,461.76 | 122,081.59 | 10,173.47 |
| January 2025 | 11,542.57 | 124,772.25 | 10,397.69 |
| February 2025 | 9,571.47 | 126,975.84 | 10,581.32 |
| March 2025 | 12,194.25 | 130,114.99 | 10,842.92 |
| April 2025 | 12,329.83 | 133,144.83 | 11,095.40 |
| May 2025 | 12,556.42 | 135,797.13 | 11,316.43 |
| June 2025 | 12,196.70 | 137,885.99 | 11,490.50 |
| July 2025 | 12,184.22 | 139,613.10 | 11,634.43 |
| August 2025 | 13,279.99 | 142,608.05 | 11,884.00 |
| September 2025 | 13,415.30 | 145,890.69 | 12,157.56 |
| October 2025 | 13,436.42 | 148,332.37 | 12,361.03 |
If [Rolling 12M Sales] equals [Total Sales] on every row, the window is not reaching back — check that MAX ( Calendar[Date] ) is the start date inside the DATESINPERIOD call and that the interval reads -12, MONTH. If the rolling total is blank, the calendar table is the suspect: either it was not marked as the date table, or its range does not cover the months the window needs.
Traps
TRAP — A ROLLING TOTAL IS NOT A YEAR TO DATE. A year-to-date measure such as the one in the year-to-date guide resets on 1 January, so its October figure covers ten months and its January figure covers one. A rolling 12-month total never resets: every full window covers exactly 12 months, which is what makes January and October directly comparable. Pick the measure that matches the question.
TRAP — THE FIRST ELEVEN MONTHS ARE NOT 12-MONTH TOTALS. The window sums whatever months exist behind the current one. In a file that starts in January 2024, the figures before December 2024 cover eleven months or fewer, and the monthly average divides those partial sums by 12 as well, so it understates the month. Compare full windows only — in this file, December 2024 onward.
TRAP — NO DATE TABLE, NO WINDOW. DATESINPERIOD against the sales table's own Month column returns blank, not an error, because the function works on a continuous date column. The visual looks fine and the numbers are empty. Build and mark the calendar table first, as in step 2.
End state
A calendar table marked as the date table, a one-to-many relationship to sales, and three measures. The table visual shows eleven full windows, from $122,081.59 for the 12 months ending December 2024 to $148,332.37 for the 12 months ending October 2025 — a rise of $26,250.78, with the rolling total higher in every month than in the month before it. The same three measures work on any sales table with a date column and a calendar table — only the table and column names change.
Sources
- Microsoft Learn, DATESINPERIOD function (DAX) — returns a table of dates beginning from the latest date for the last year in the page's MAX example; a negative interval count runs backward
- Microsoft Learn, MAX function (DAX) — returns the largest value in a column in the current context
- Microsoft Learn, CALCULATE function (DAX) — evaluates an expression in a modified filter context
- Microsoft Learn, DIVIDE function (DAX) — performs division and returns BLANK() on division by zero
- Microsoft Learn — Set and use date tables in Power BI Desktop — when a date table must be marked, and how to mark it
Written November 12, 2026